Michaela Vojtěchovská and Stanislav Popelka have published GazePlotter in Behavior Research Methods, a leading journal in the field. GazePlotter is an open-source, browser-based application that generates interactive scarf plots (sequence charts) directly from raw eye-tracking exports, without scripting, installation, or server-side processing.
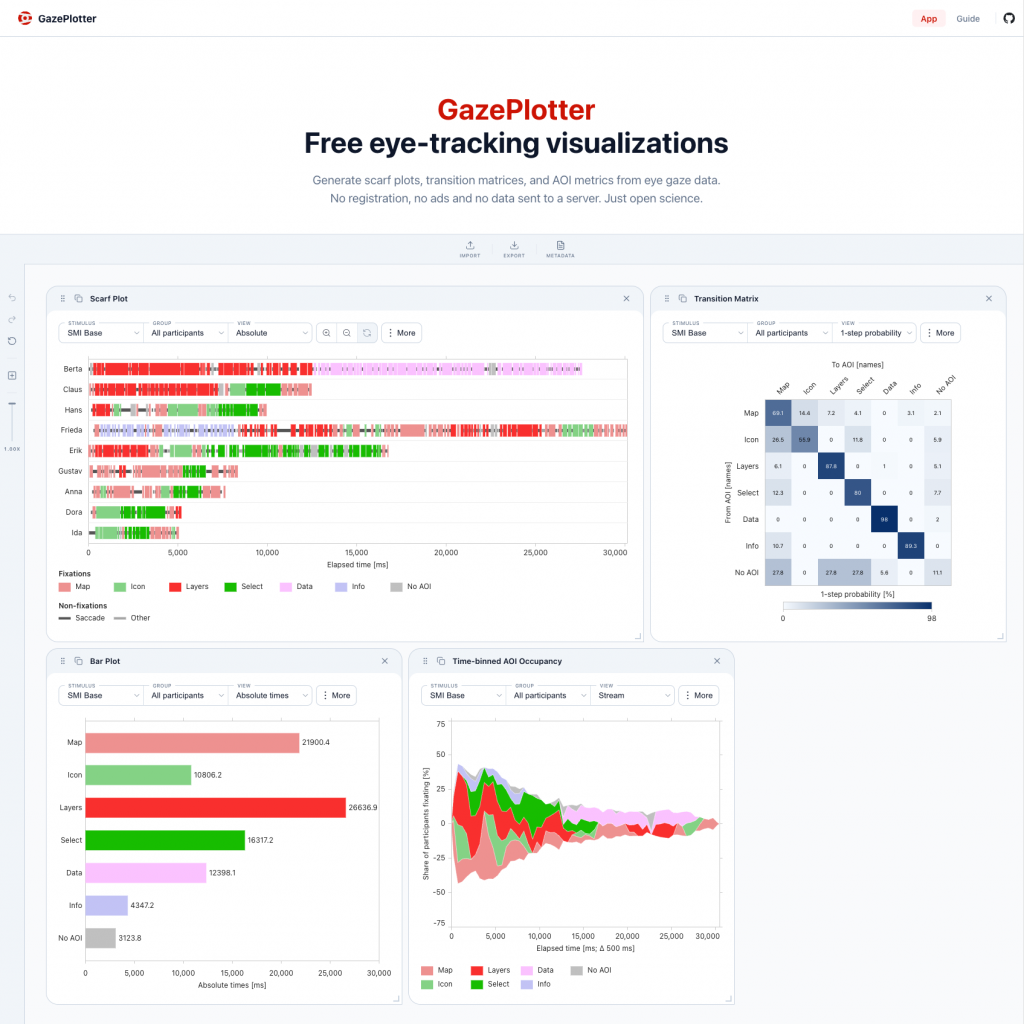
Scarf plots show when and to what participants attend over time, preserving the temporal structure that heatmaps and aggregate dwell-time metrics discard. Yet they remain rarely implemented. Among proprietary manufacturer software, only the discontinued SMI BeGaze generated them, and existing open-source alternatives each impose custom data formats, omit dynamic AOI support, or require remote processing. GazePlotter targets exactly this gap.
The tool automatically recognises exports from six eye-tracking software packages (SMI BeGaze, Tobii Pro Lab, OGAMA, GazePoint Analysis, Varjo XR, and Pupil Cloud), plus generic CSV. All computation runs client-side in the browser, so gaze data, which can reveal sensitive personal attributes, never leaves the user’s device. You can try it directly at gazeplotter.com. Key capabilities include dynamic AOI visibility layers, three timeline modes (absolute, relative, ordinal), side-by-side comparison views, and shareable JSON dashboards that retain the full analytic state for reproducibility.
Validation against Tobii Pro Lab and SMI BeGaze showed AOI-level metric agreement within ±1 ms, with exact matches on fixation counts. The streaming parser handled a 12.76 GB dataset in under four minutes on a mid-range laptop, with heap memory staying below 30 MB throughout. A usability evaluation (N = 35) rated the tool’s hedonic quality among the strongest in the UEQ-S global benchmark, with pragmatic quality above average.
The broader implication is methodological reach beyond eye-tracking. By abstracting any ordinal categorical sequence as pseudo-AOIs over a timeline, GazePlotter works as a general-purpose sequence analysis engine; it has already been applied to the structural content analysis of school atlases. The full source code is available on GitHub under GPLv3. Development continues, with further visualisation types and analytic metrics planned as the tool grows.
You can read the paper, “GazePlotter: An open-source solution for the automatic generation of scarf plots from eye-tracking data“, in Behavior Research Methods.