Author:
Alžběta Brychtová
Contact:
alzbeta.brychtova@gmail.com
Type of research:
PhD research
Type of stimuli:
Static images
Date:
01/2012
The primary goal of this study is to empirically analyse the influence of colour distance and font size on map readability.
Methods
Procedure
We systematically evaluated 5 sequential and 5 qualitative colour schemes in a two-stage user experiment. At first, we conducted an online study to obtain data of large variety of heterogeneous population. Following this, in a controlled lab study with eye-tracking, we re-examined the findings from the online study for a subset of experimental stimuli and further assessed the user experience through an analysis of their visual behaviour.
In a within-subject manner, participants were asked to find an administrative unit by its name and mark it with a mouse click within a given time limit.
Each trial contained a text stimulus with the task description, a fixation cross and a map. We presented the task description for 30 seconds, the fixation cross for 0.5 seconds, and the map stimulus for 30 seconds.
Independent variables
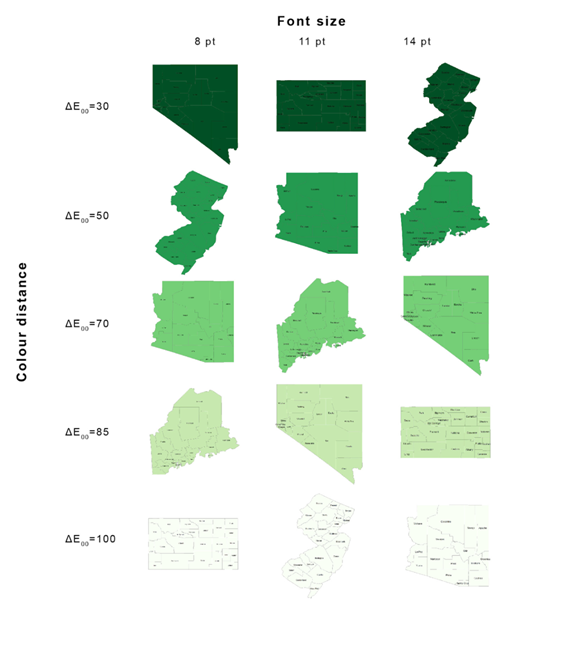
The general hypothesis of the study is that increasing colour distance between map labels and background and increasing font size will have a positive impact on the readability, i.e. map users will have less trouble while searching for and reading the labels. To test this hypothesis, we studied two independent variables: colour distance and font size.
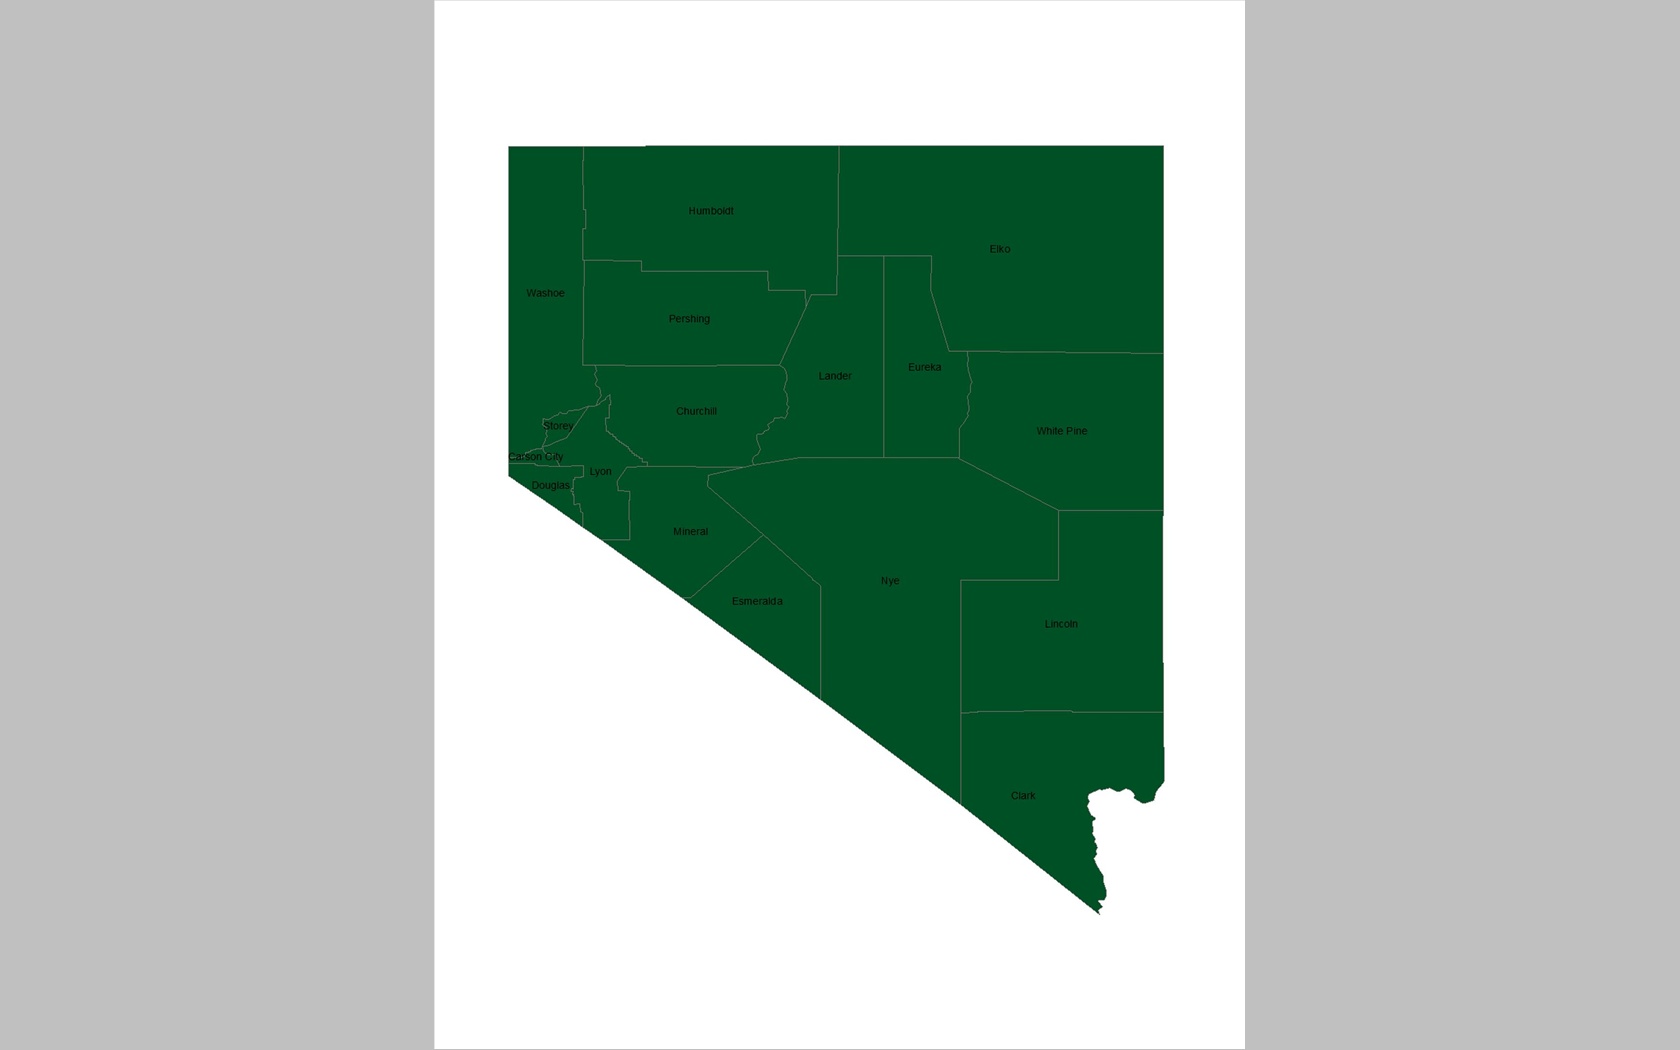
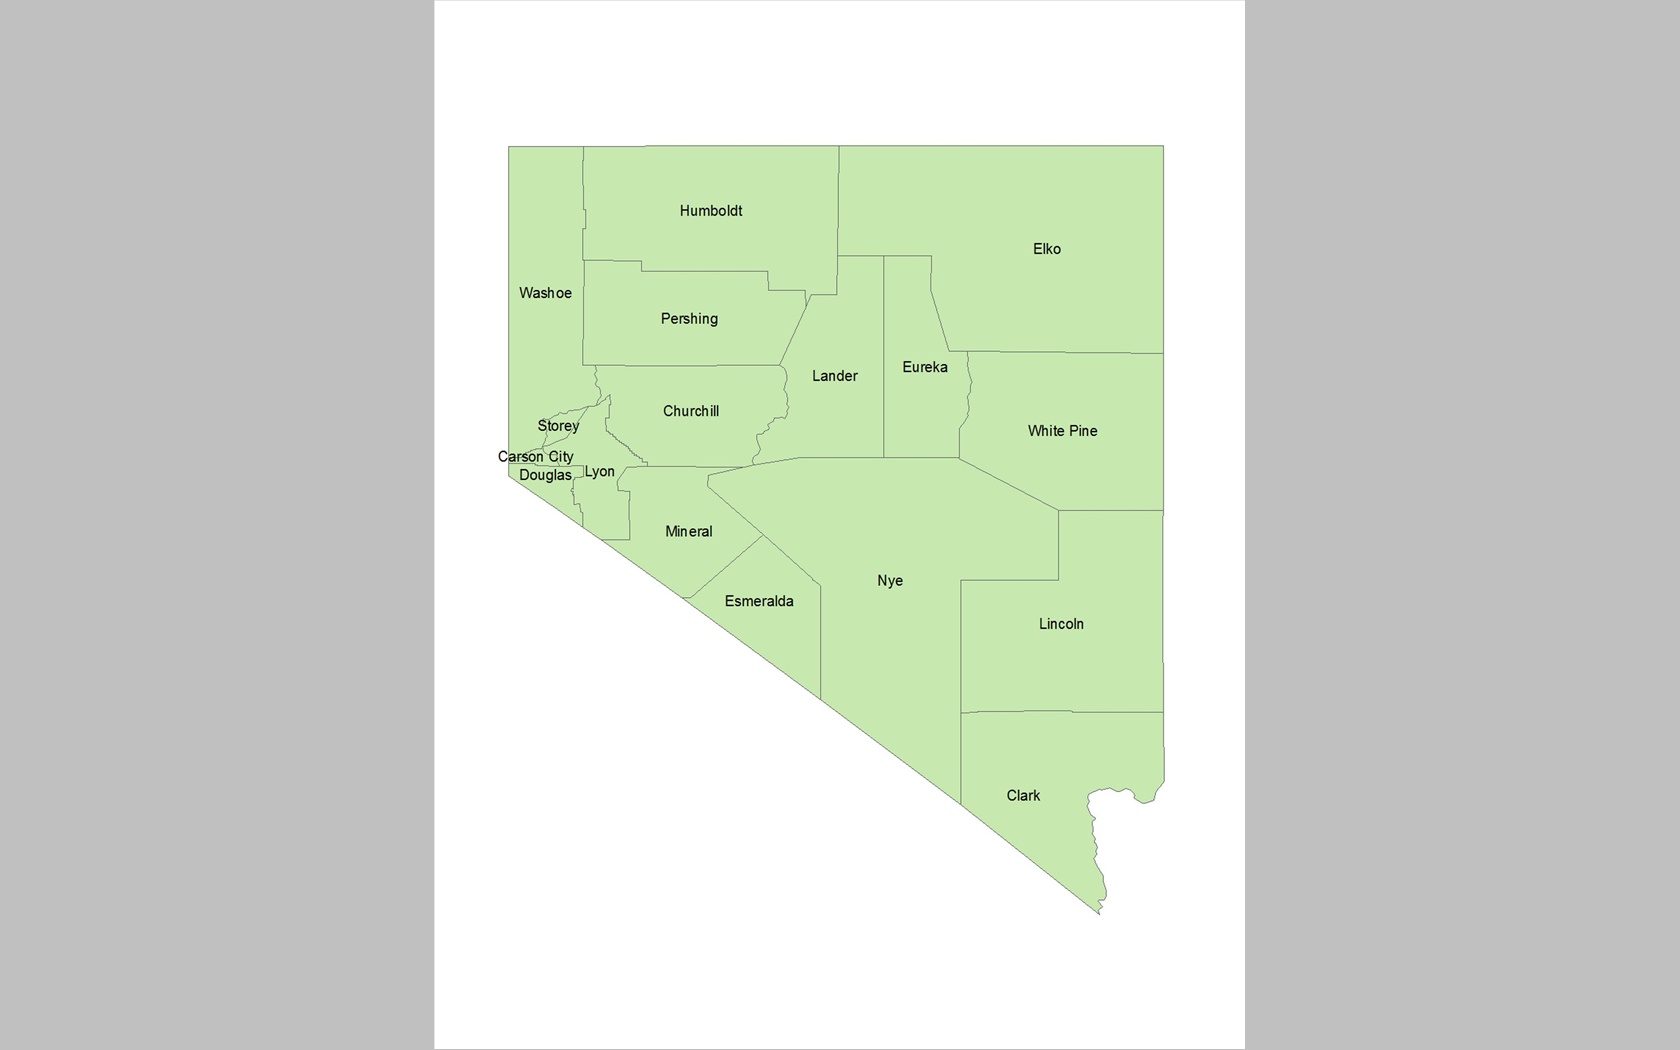
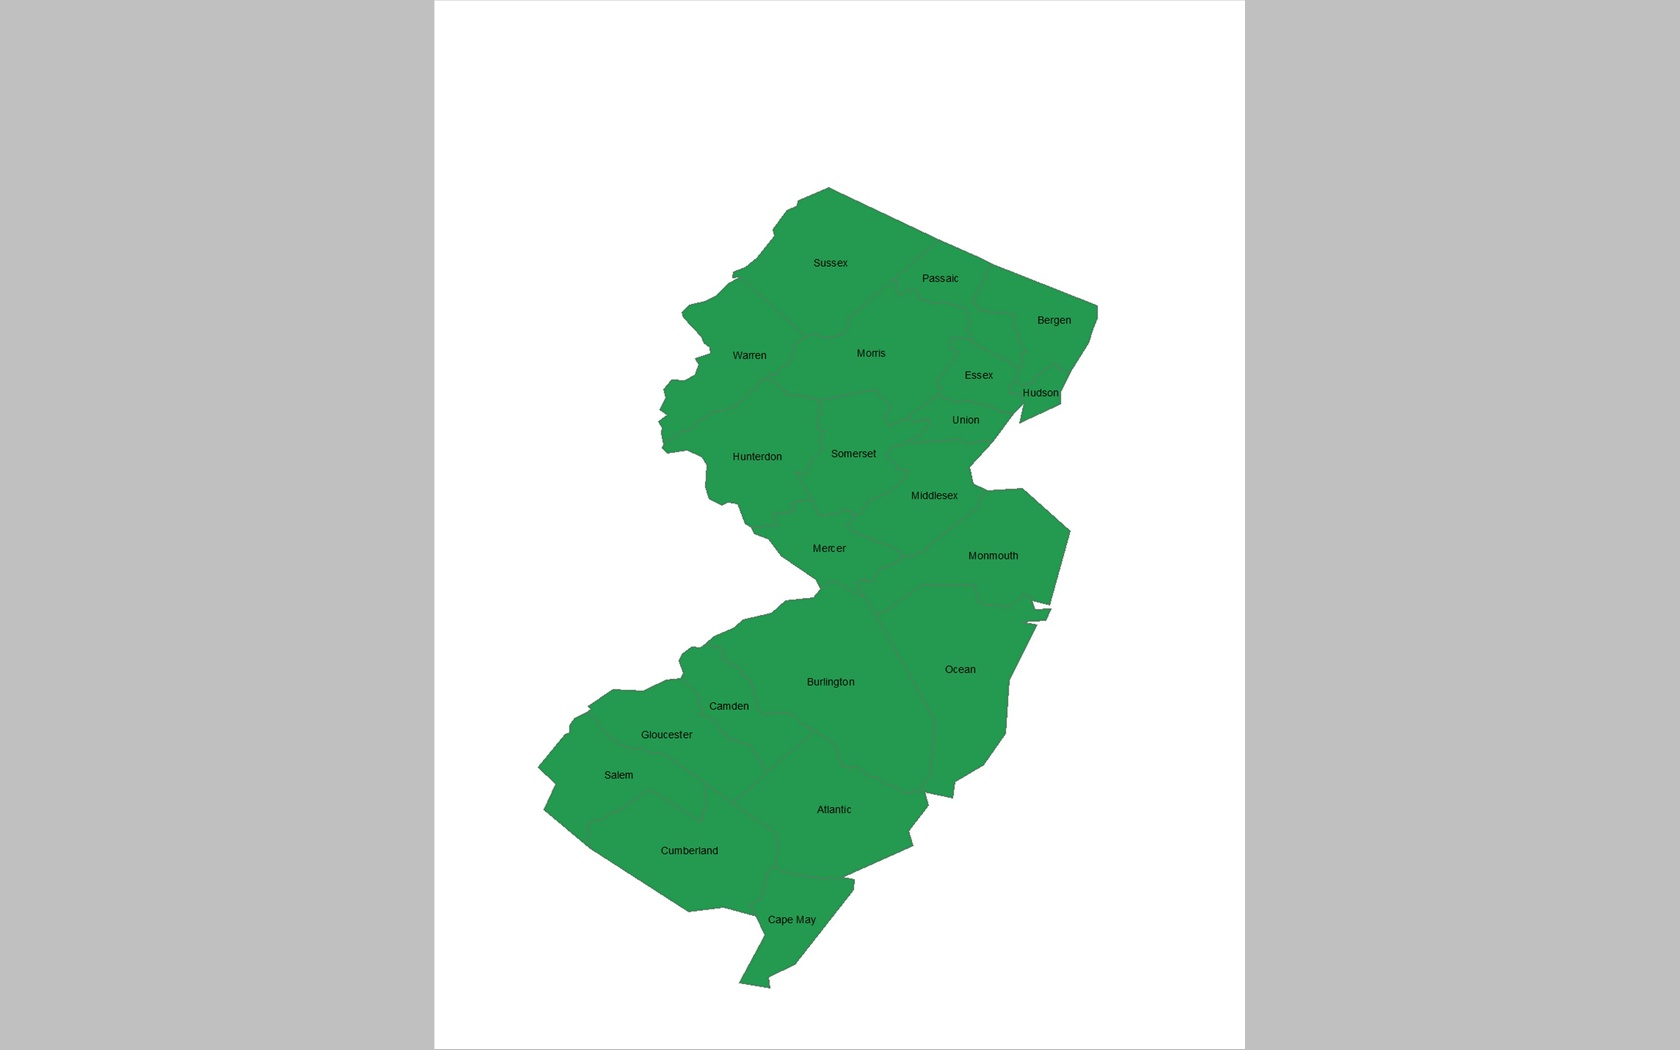
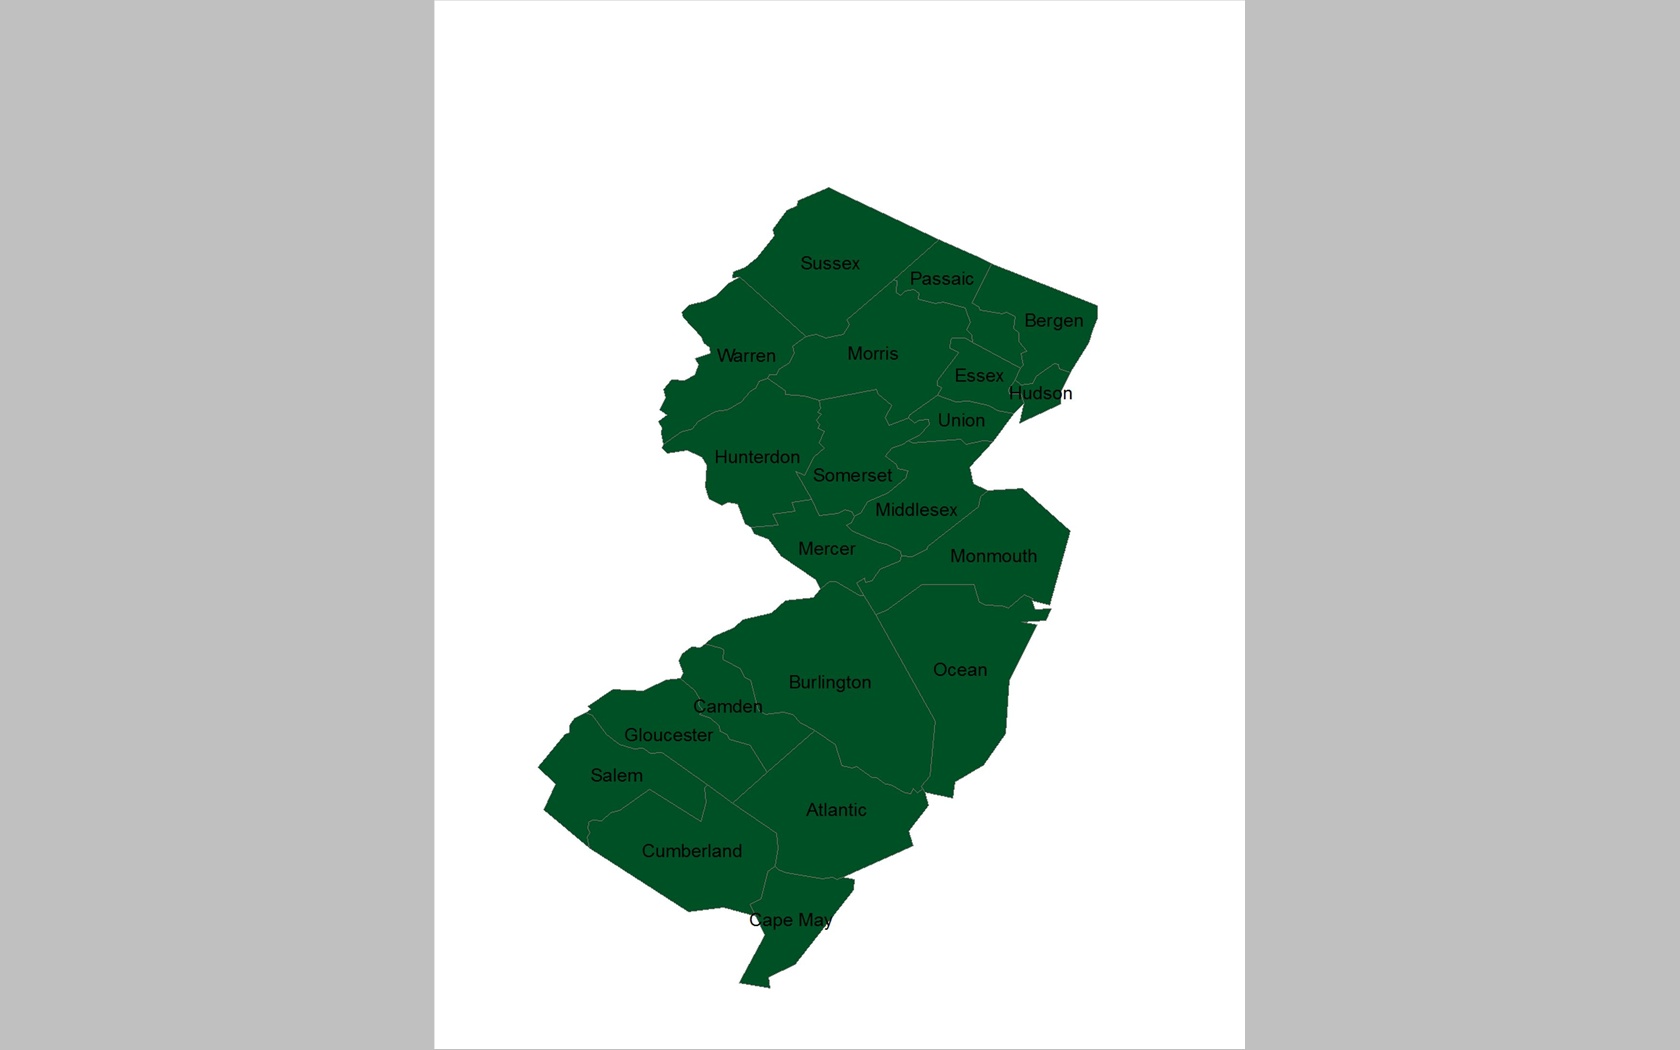
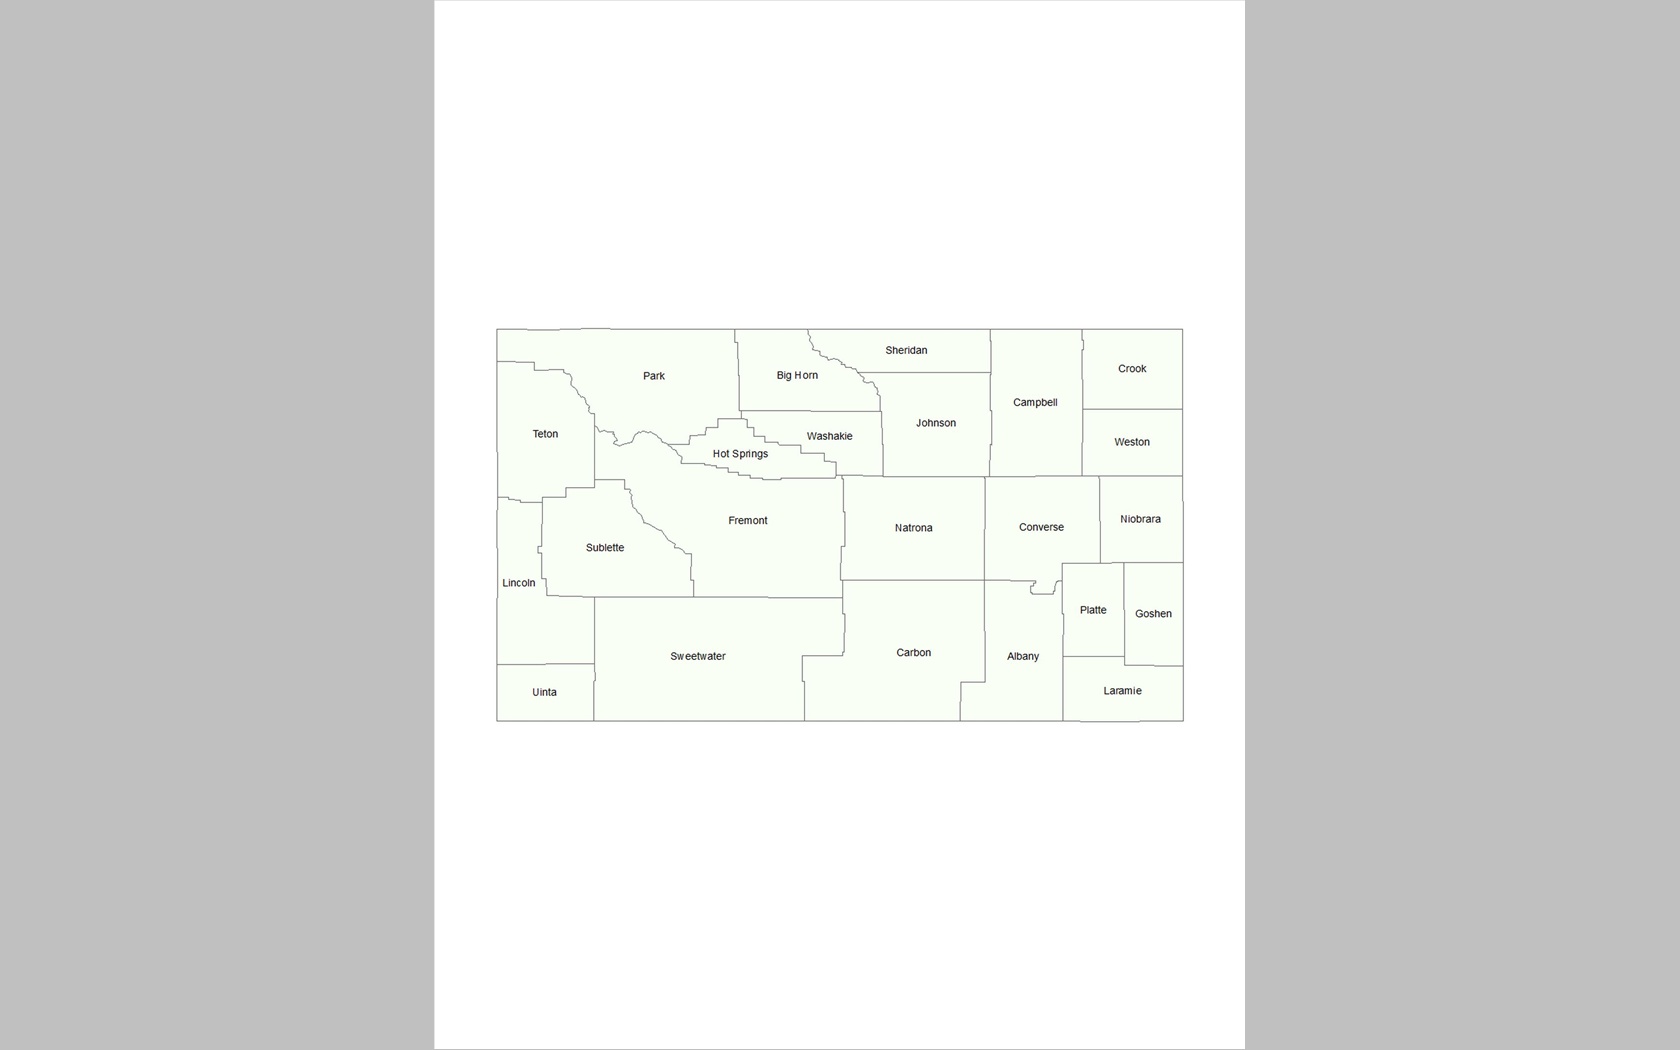
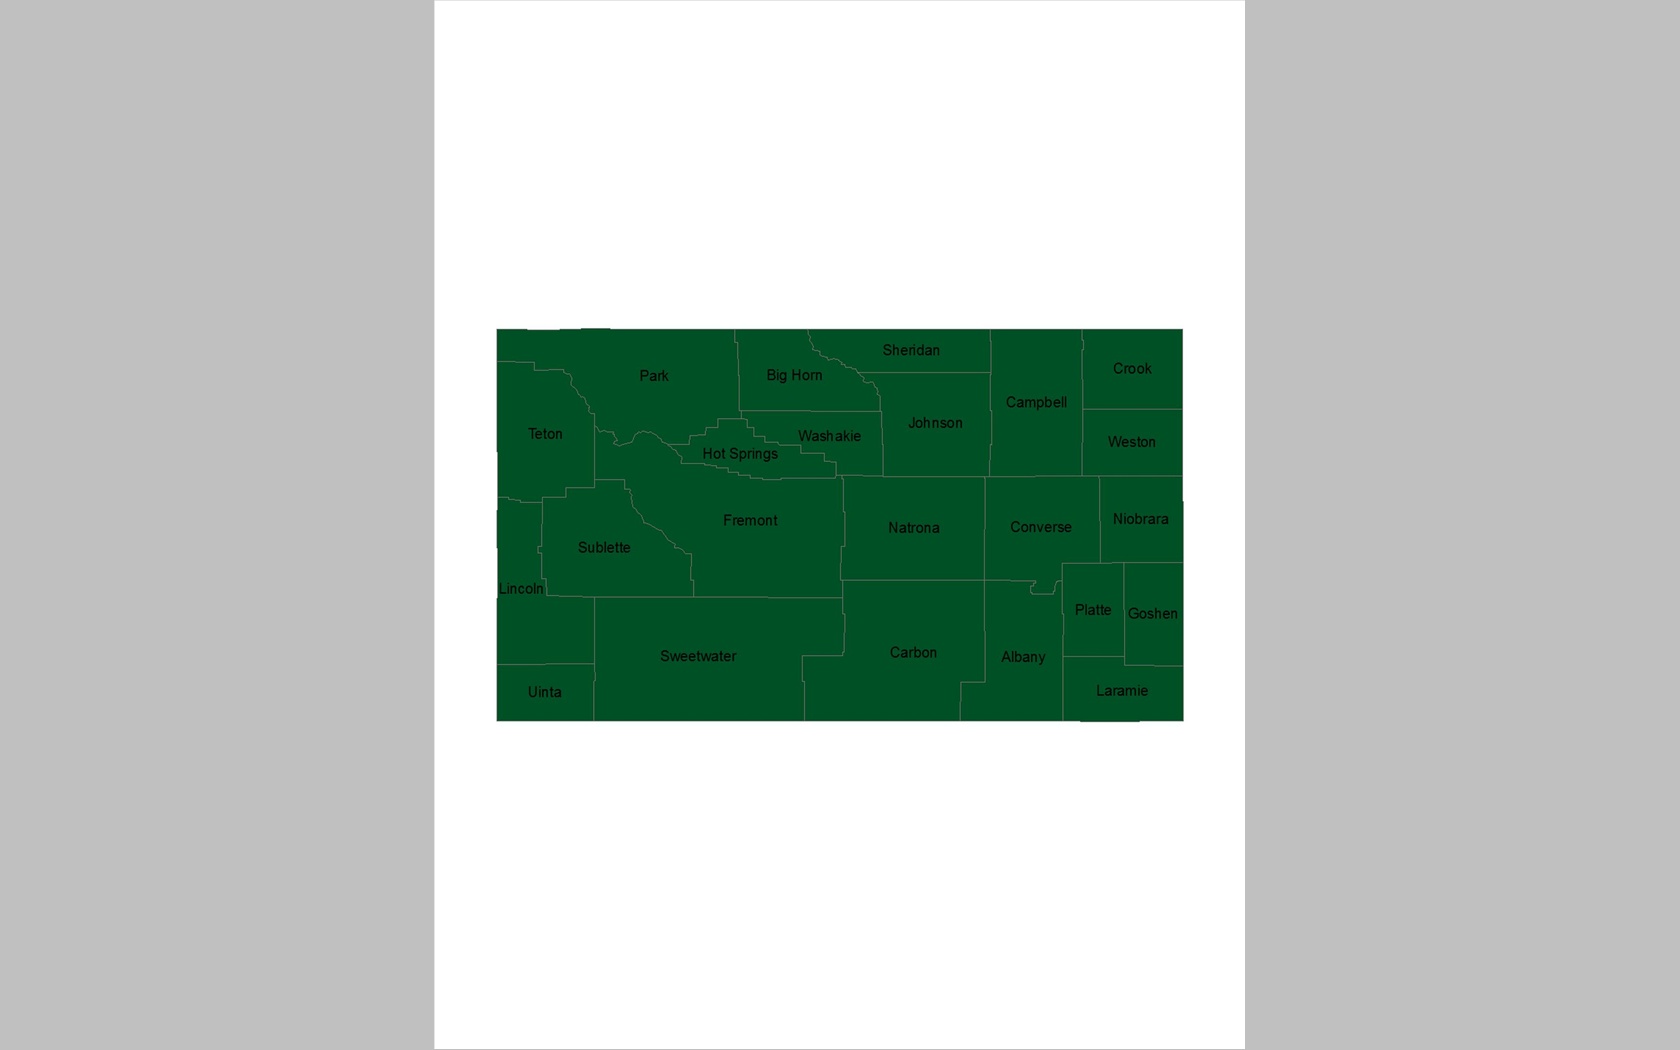
Five levels of colour distance (CIEDE2000 ΔE00= 30, 50, 70, 85 and 100) and three levels of font size (8, 11 and 14 pt.) were examined.
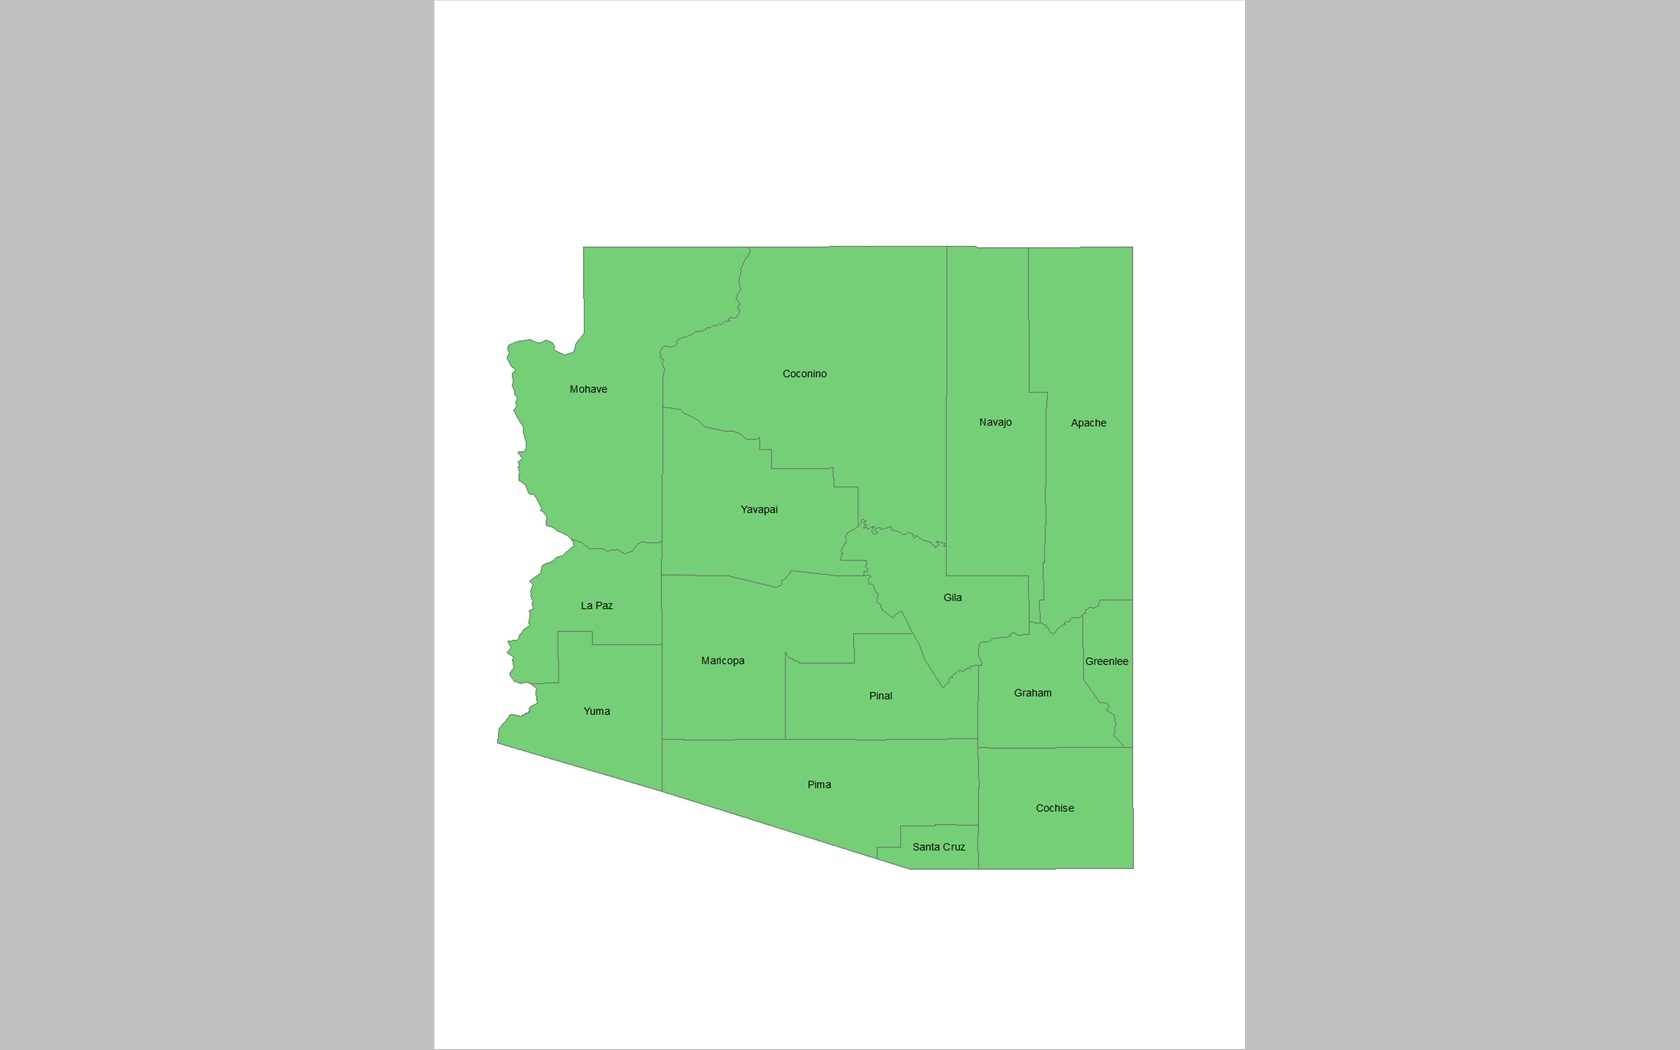
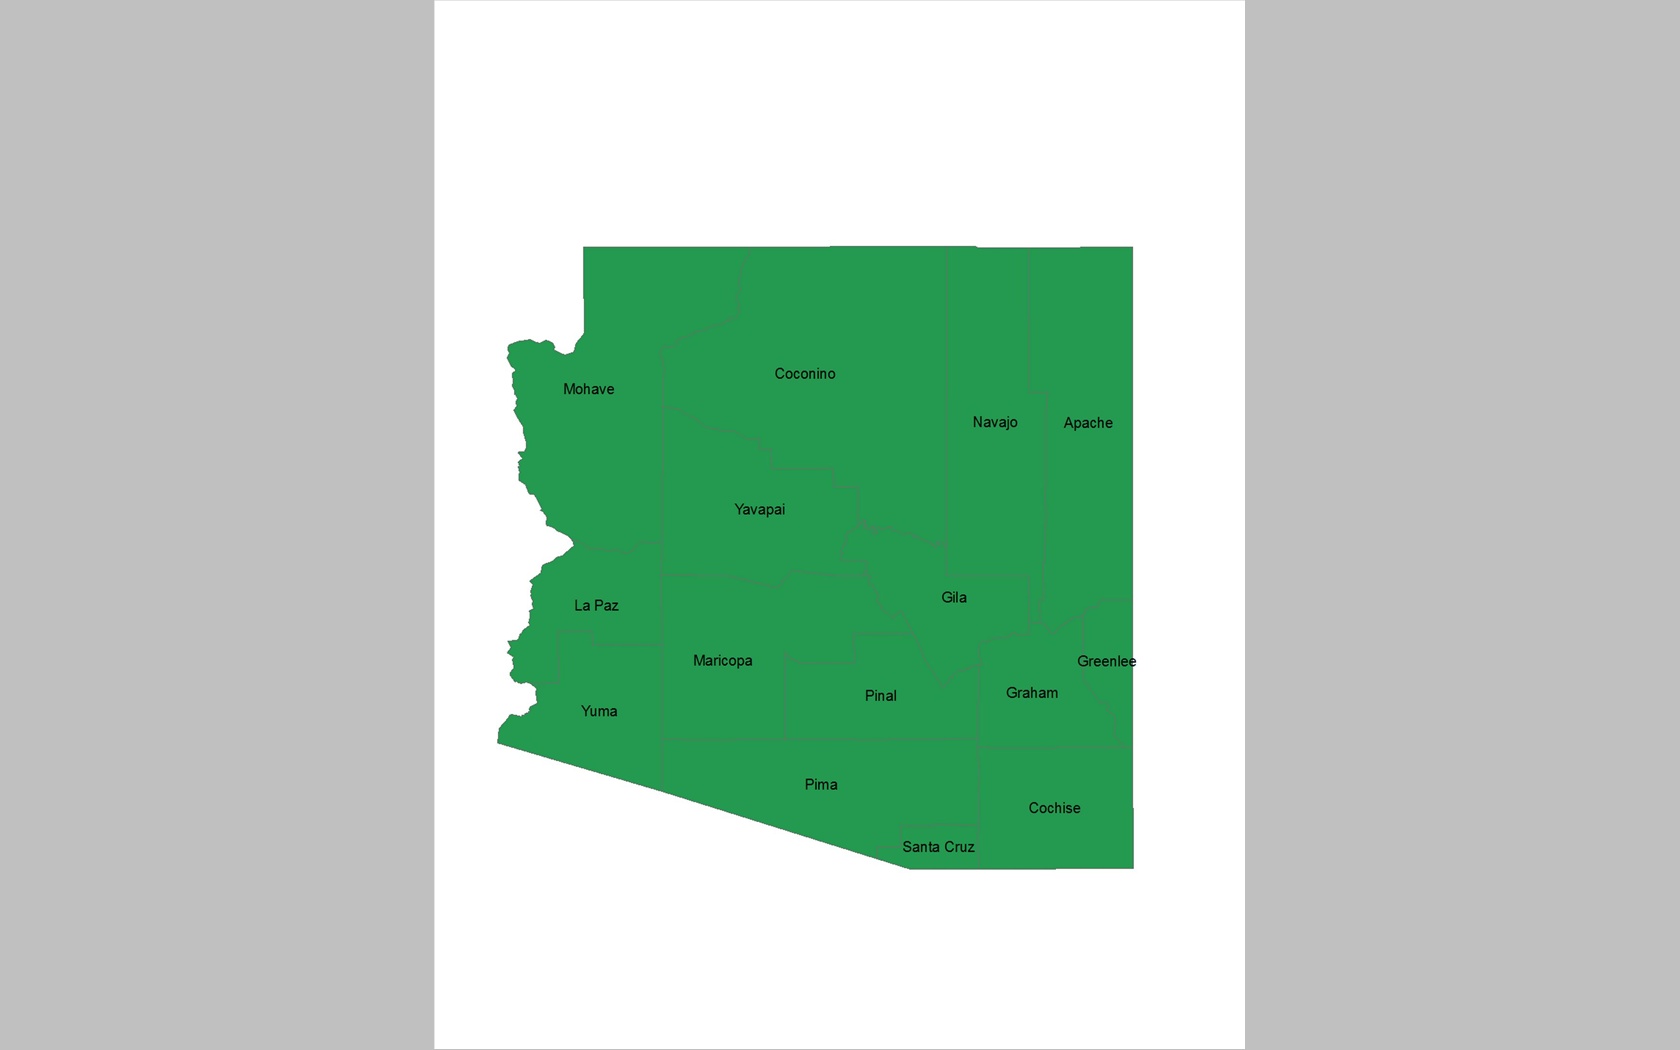
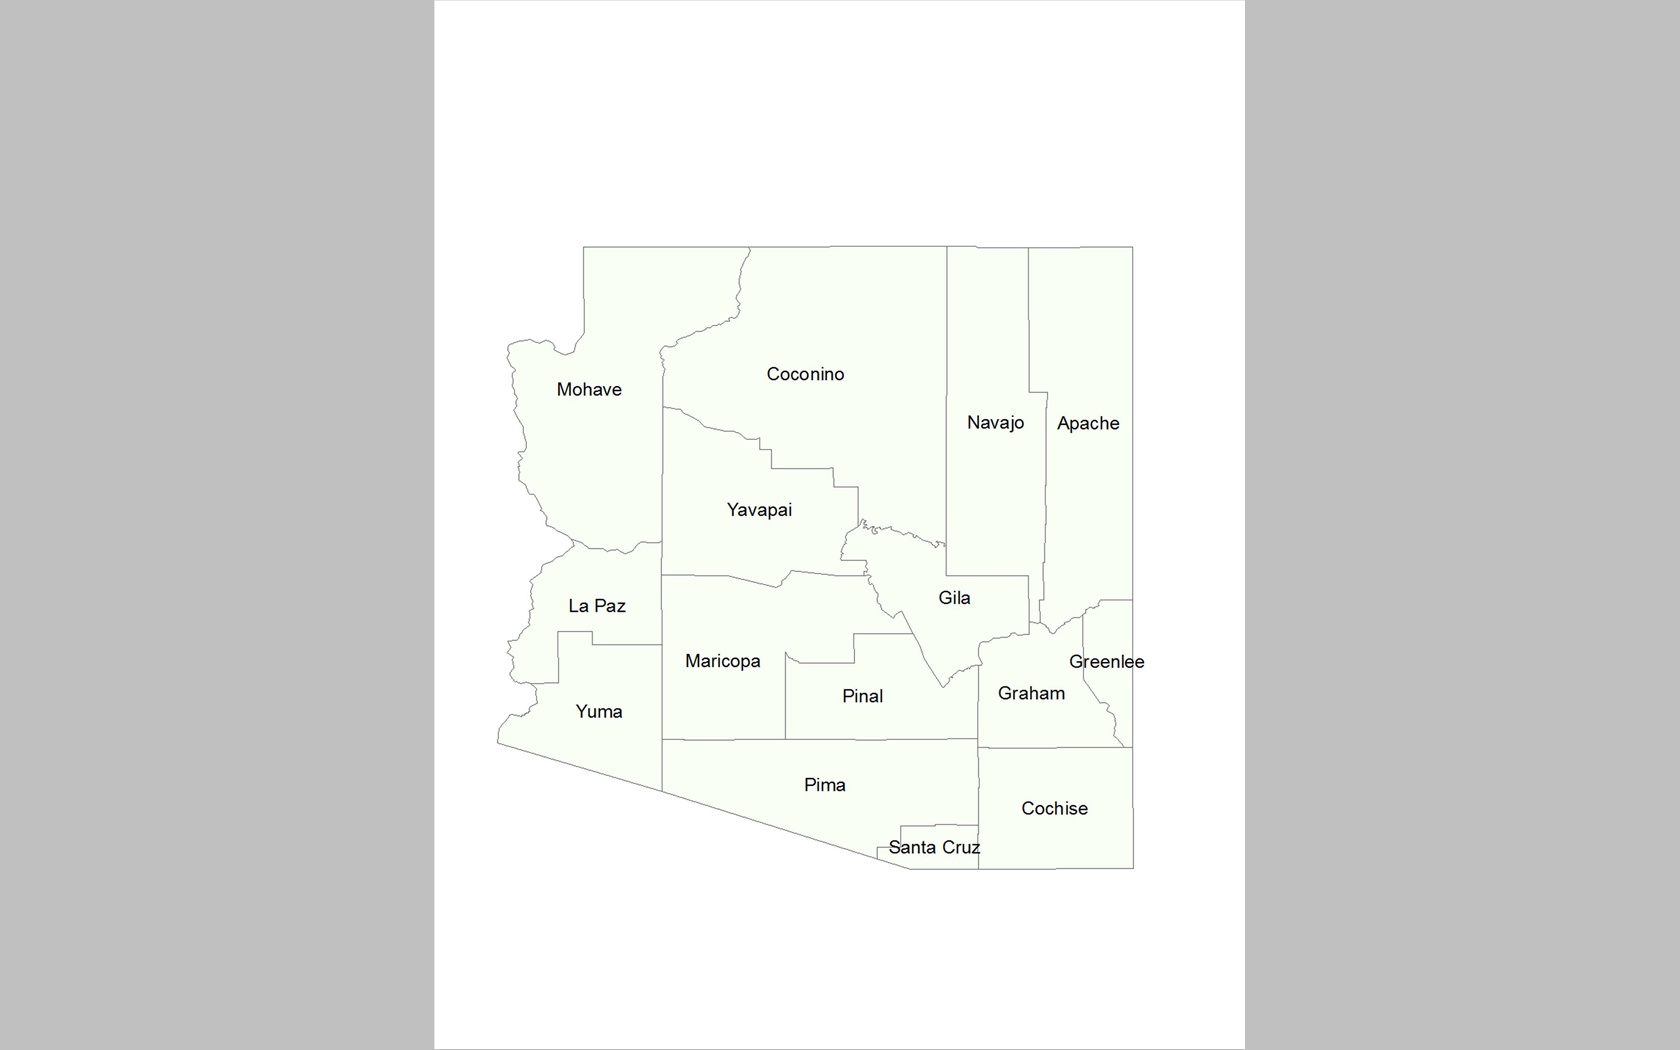
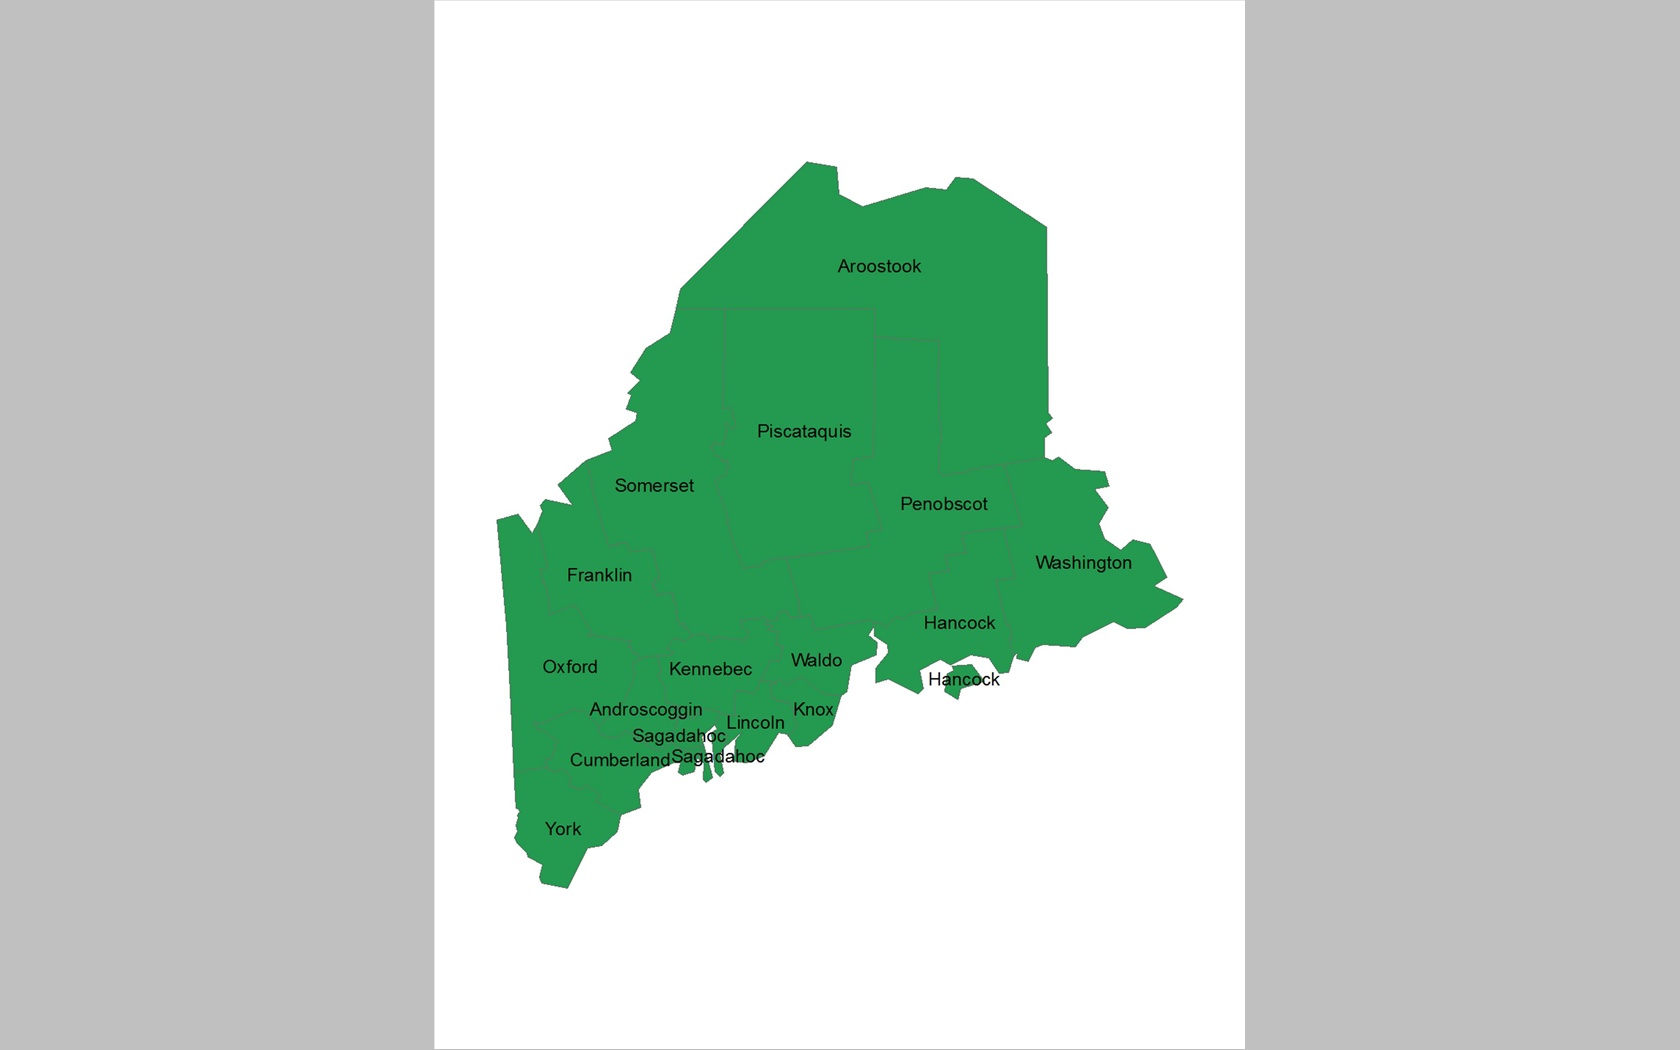
Stimuli
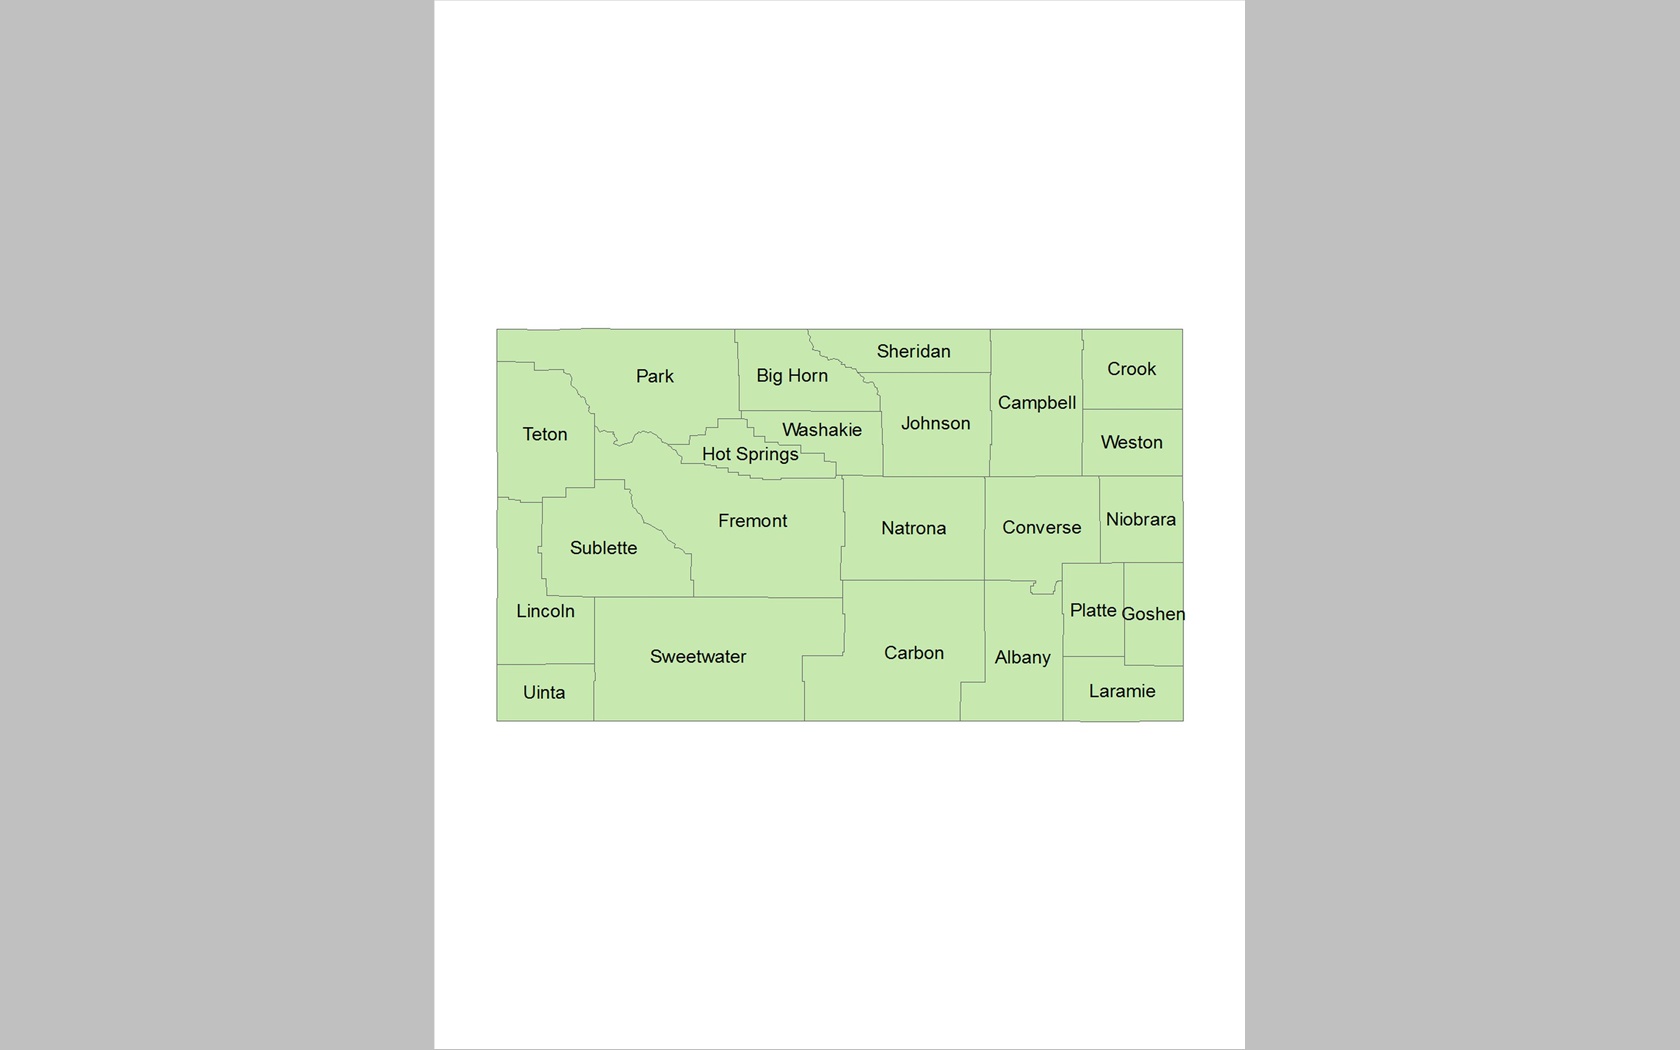
Stimuli include names of administrative units of 5 different states of USA (Arizona, Nevada, Maine, New Jersey and Wyoming). The shapes of the states as well as number of labels (administrative units) on stimuli varied (Arizona 15, Nevada 17, Maine 18, New Jersey 21, and Wyoming 24).
A total of 15 maps were prepared. Each stimulus is characterized by the concrete value of colour distance between labels and the background colour.


Participants
53 volunteers took part in the experiment and they were offered no compensation. The participant age ranged between 20–25 years. All of them were students of Palacký University. 30 out of 50 participants (~60%) took at least one cartography course (‘experts’), 20 out of 50 participants (~40%) have no previous cartography experience (‘novices’). 28 of them were males and 22 were females. None of participants reported any colour vision deficiency.
Apparatus
For the eye-tracking study the remote eye-tracking device SMI RED 250, developed by SensoMotoric Instruments, was used.
Analyses
We used eye-tracking to determine the efficiency and strategy of stimulus reading. Our dependent variables were accuracy, speed, and a selected set of eye movement metrics, namely fixation frequency, fixation duration and scanpath speed, to interpret users’ strategies, as well as an area of interest (AOI) analysis.
Conclusion
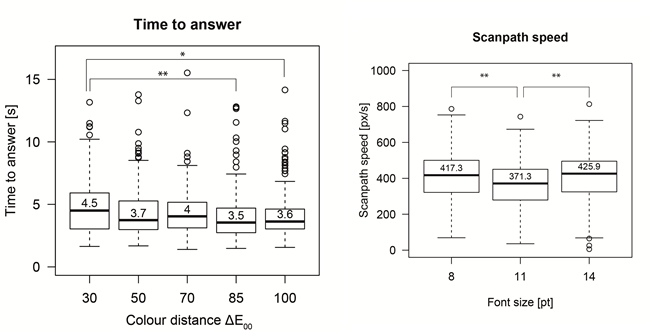
All participants were successful in locating the searched items in all conditions within the time limits (i.e. accuracy was 100%). Analysing the time to answer for the five colour distances empirically validates what is common sense; the relative differences in time to answer become statistically significant as the colour distances grow larger (30-85, and 30-100). More precisely, observed median value of time to answer on the stimuli with ΔE00=30 was Mdn=4.5 s. Median time on ΔE00=85 was Mdn=3.5 s and on ΔE00=100 was Mdn=3.6 s.
The comparison of the font size based on scanpath speed metrics suggests that the medium font size (11 pt) is the most efficient.
Outputs
Brychtova, A. and Coltekin, A. (2014). An Empirical User Study for Measuring the Influence of Colour Distance and Font Size in Map Reading Using Eye Tracking. The Cartographic Journal, 0(0), pp. 1743277414Y.000. doi:10.1179/1743277414Y.0000000103