Eye-tracking testing of data flow diagrams
(Zdena DOBEŠOVÁ)
zdena.dobesova@upol.cz
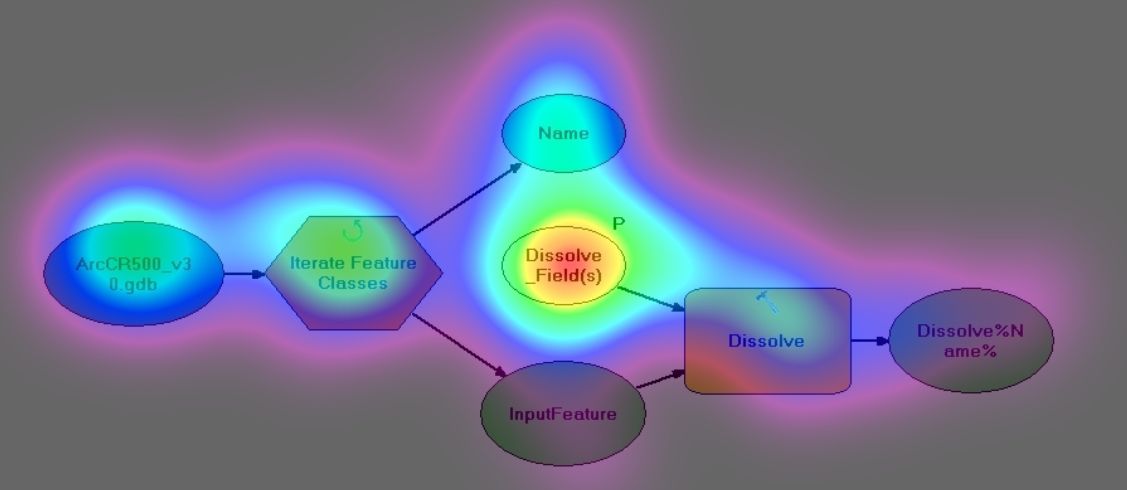
Geographic information systems (GIS) are supplemented by components for design data flow diagrams (DFD) in a graphical way. The data flow diagrams are oriented graphs where graphical elements are connected by straight or curved lines. Eye tracking testing is used for investigation the quality of graphical notation from the point of perception and cognition. The tests have processed several graphical editors for DFD in GIS. They are ModelBuilder in ArcGIS for Desktop, Macro Modeler in IDRISI, Model Maker and Spatial Model Editor in ERDAS IMAGINE and Dataflow Designer in AutoCAD Map 3D.
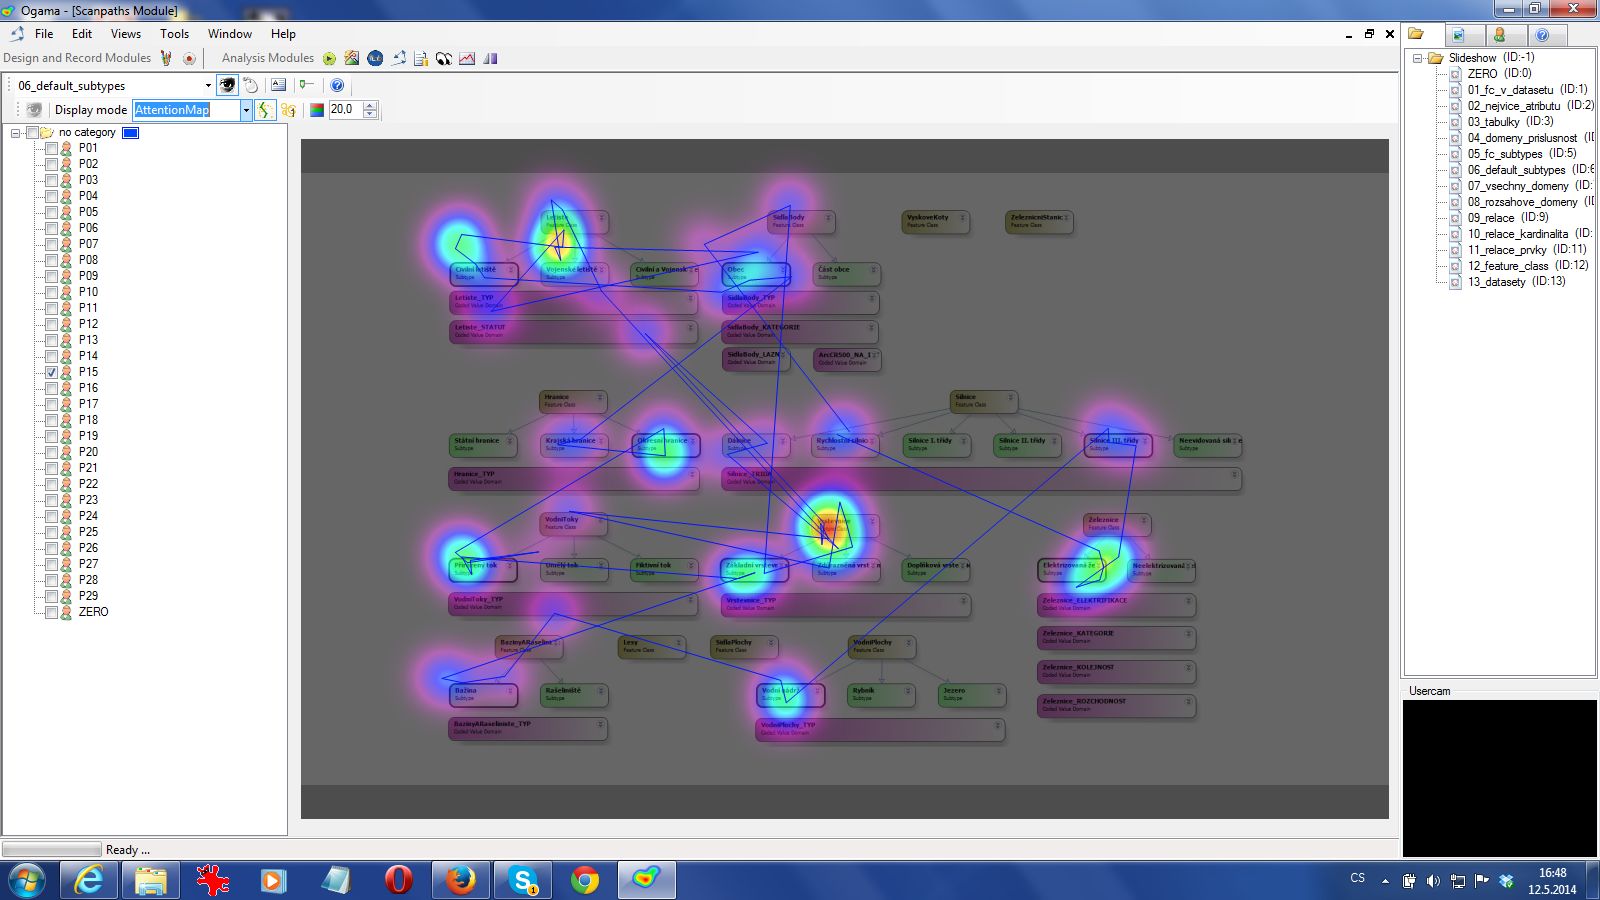
Result heat maps of diagram, gaze plots of diagram and time responses could discover the level of perceptual discriminability, dual codding and visual expressiveness of graphic elements in diagrams. Gaze plots report the direction of respondent reading for various orientations of diagrams (left–right, top-down orientation, mixed orientation).
Moreover, the ERA diagrams were tested by eye-tracking for geodatabase design in ArcGIS Diagrammer.
Final results of eye-tracking testing can be compared with the results obtained by applying Daniel Moody’s scientific theory “Physics of Notation”. The results can help to improve graphical notation of DFD for GIS.